SharpeIQ Research · Earnings Season · Q3 2026 · 30 October 2026
Abstract
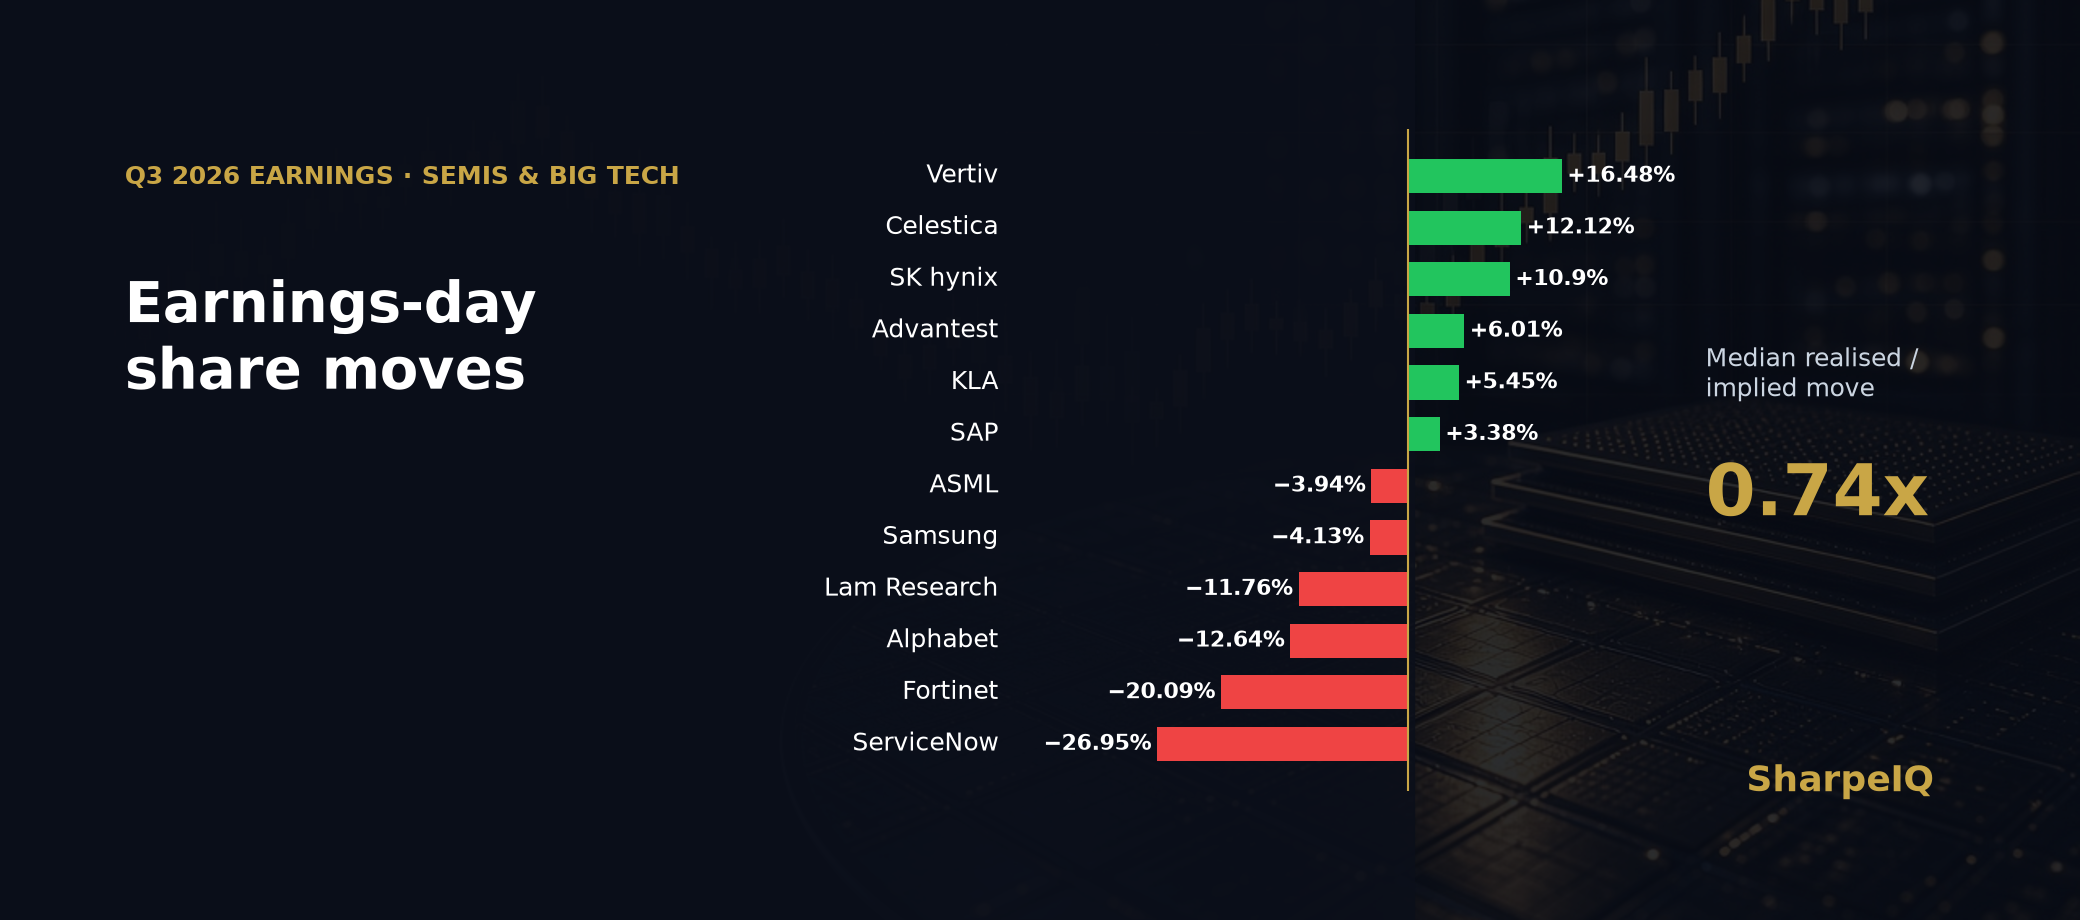
This note scores 25 Q3 2026 earnings across memory, semicap, foundry/logic/analog, hyperscalers, software and the AI supply chain, as of 30 October 2026. Memory had the strongest results: SK hynix beat on operating profit by 8.6% at an 80% margin and rose 10.9%, while Samsung was in line and fell 4.13%. Elsewhere, beats were sold whenever guidance or cash flow disappointed. Intel beat but guided Q4 revenue $1.6bn below consensus at the midpoint and fell more than 20% after hours. ServiceNow fell 26.95%, its worst day ever, on an 18.5% cRPO guide. Among hyperscalers, Microsoft had positive free cash flow and was flat, while Alphabet had −$9.07bn and fell 12.64%. Options mostly overpriced the event: across 21 names with a closing-price reaction, the median realised move was 0.74x the pre-report straddle.
Key takeaways
- Memory set the bar. Micron guided FQ1 to $61.5bn. SK hynix posted ₩83.33T operating profit (80% margin) and rose 10.9%. Samsung was in line and fell 4.13%.
- Intel and ServiceNow were the season’s two biggest blow-ups. Intel’s Q4 guide was $15–16bn against $17.1bn; ServiceNow’s cRPO guide was 18.5% against c. 19.5–19.8%.
- Semicap was split. Advantest raised its full-year guide and rose 6.01%, and KLA rose 5.45%; supply-limited Lam Research fell 11.76%.
- Free cash flow sorted the hyperscalers. Microsoft −0.16%, Meta −6.98%, Alphabet −12.64%, Amazon c. −7.3% after hours.
- AI power and cooling won. Vertiv’s organic orders more than doubled and it rose 16.48%.
- Straddles were rich. The median ratio was 0.74x, but guidance misses produced tails of 1.6–2.5x. Nvidia reports on 17 November, after the close.
1. Q3 2026 earnings scorecard: semiconductor and big tech earnings
All times US Eastern (ET).
Memory
| Company | Reported (ET) | Q3 revenue vs est. | Q3 EPS vs est. | Move |
|---|---|---|---|---|
| Micron Technology (MU) | 30 Sep, after the close | $54.23bn vs $51.07bn | $33.42 vs $31.61 | Little changed |
| SK hynix (000660.KS) | 27 Oct, 8 PM | ₩104.62T vs ₩98.34T | OP ₩83.33T vs ₩76.72T | +10.9% |
| Samsung Electronics (005930.KS) | 28 Oct, after the close | ₩195.25T vs ₩195.79T | OP ₩107.44T vs ₩107.66T | −4.13% |
Guidance (next quarter unless stated):
- Micron Technology (MU): FQ1 revenue $61.5bn ±$1.5bn; EPS $38.15.
Semicap
| Company | Reported (ET) | Q3 revenue vs est. | Q3 EPS vs est. | Move |
|---|---|---|---|---|
| ASML Holding (ASML) | 14 Oct, before the open | €11.66bn vs €11.72bn | NI €4.96bn vs €4.1bn | −3.94% |
| Lam Research (LRCX) | 21 Oct, after the close | $8.22bn vs $8.13bn | $2.20 vs $2.18 | −11.76% |
| Advantest (6857.T) | 28 Oct, before the open | ¥477.7bn vs c. ¥429.6bn | OP ¥266.8bn | +6.01% |
| KLA (KLAC) | 28 Oct, after the close | $4.14bn vs $4.04bn | $1.22 vs $1.18 | +5.45% |
Guidance (next quarter unless stated):
- ASML Holding (ASML): Q4 revenue €14.2–15.2bn; FY26 revenue €44–45bn, raised from €43–45bn.
- Lam Research (LRCX): Next-quarter revenue $8.6bn ±$0.4bn, constrained by supply.
- Advantest (6857.T): Full-year revenue raised to ¥1.863T and operating profit to ¥967bn.
- KLA (KLAC): Next-quarter revenue $4.7bn ±$0.2bn.
Foundry/logic/analog
| Company | Reported (ET) | Q3 revenue vs est. | Q3 EPS vs est. | Move |
|---|---|---|---|---|
| TSMC (TSM) | 15 Oct, before the open | $46.72bn vs $45.54bn | $4.60 vs $4.42 per ADR | −1.80% |
| Texas Instruments (TXN) | 21 Oct, after the close | $6.06bn vs $5.92bn | $2.62 vs $2.42 | −1.81% |
| NXP Semiconductors (NXPI) | 27 Oct, after the close | $3.79bn vs $3.76bn | $4.20 vs $4.11 | −0.71% |
| STMicroelectronics (STM) | 29 Oct, before the open | $3.76bn vs $3.72bn | $0.37 vs $0.40 | ADR +3.03% |
| Intel (INTC) | 29 Oct, after the close | $16.51bn vs $16.5bn | $0.52 vs $0.40 | Fell >20% after hours |
Guidance (next quarter unless stated):
- TSMC (TSM): Q4 revenue $52.3–54.3bn; 2026 capex $60–64bn.
- Texas Instruments (TXN): Q4 revenue $5.8–6.3bn; EPS $2.45–2.79.
- NXP Semiconductors (NXPI): Q4 revenue midpoint $3.85bn, against $3.86bn consensus.
- STMicroelectronics (STM): Q4 revenue $4.15bn.
- Intel (INTC): Q4 revenue $15–16bn and EPS $0.25, against $17.1bn and $0.43 consensus.
Hyperscalers
| Company | Reported (ET) | Q3 revenue vs est. | Q3 EPS vs est. | Move |
|---|---|---|---|---|
| Meta Platforms (META) | 21 Oct, after the close | $64.60bn vs $63.37bn | $3.83; $7.40 ex-charge vs $5.74 | −6.98% |
| Tesla (TSLA) | 21 Oct, after the close | $28.05bn vs c. $27.9bn | $0.48 vs $0.45 | −3.08% |
| Microsoft (MSFT) | 28 Oct, after the close | $92.28bn vs $90.69bn | $4.89 vs $4.73 | −0.16% |
| Alphabet (GOOGL) | 28 Oct, after the close | $127.58bn vs $128.22bn | $2.67 vs $3.02 | −12.64% |
| Amazon (AMZN) | 29 Oct, after the close | $201.94bn vs $202.31bn | $1.89 vs $1.96 | c. −7.3% after hours |
Guidance (next quarter unless stated):
- Meta Platforms (META): Q4 revenue $73–76bn; capex $135–145bn.
- Tesla (TSLA): FY26 capex c. $20bn.
- Microsoft (MSFT): Calendar 2027 capex c. $170bn, from $175bn.
- Alphabet (GOOGL): FY26 capex $195–205bn, unchanged.
- Amazon (AMZN): Q4 revenue $240–247bn, against $244.5bn consensus.
Software
| Company | Reported (ET) | Q3 revenue vs est. | Q3 EPS vs est. | Move |
|---|---|---|---|---|
| IBM (IBM) | 21 Oct, after the close | $17.10bn vs $16.82bn | $2.95 vs $2.86 | +0.26% |
| SAP (SAP) | 21 Oct, 4:05 PM | €10.27bn vs €10.12bn | €1.89 vs €1.80 | +3.38% |
| ServiceNow (NOW) | 28 Oct, after the close | $4.106bn vs $4.10bn | $1.00 vs $1.02 | −26.95% |
| Fortinet (FTNT) | 28 Oct, after the close | $2.08bn vs $2.06bn | $0.91 vs $0.86 | −20.09% |
Guidance (next quarter unless stated):
- IBM (IBM): Full-year software growth 7–8%.
- SAP (SAP): FY26 cloud revenue toward the top of €25.8–26.2bn.
- ServiceNow (NOW): Q4 cRPO growth 18.5%, against c. 19.5–19.8% consensus.
- Fortinet (FTNT): Full-year service revenue $5.15–5.17bn, cut from $5.18–5.22bn.
AI supply chain
| Company | Reported (ET) | Q3 revenue vs est. | Q3 EPS vs est. | Move |
|---|---|---|---|---|
| Celestica (CLS) | 26 Oct, after the close | $5.83bn vs $5.48bn | $3.30 vs $2.99 | +12.12% |
| Corning (GLW) | 27 Oct, before the open | $5.08bn vs $5.03bn | $0.91 vs $0.88 | −1.13% |
| Vertiv (VRT) | 28 Oct, before the open | $4.313bn vs $3.76bn | $2.21 vs $1.82 | +16.48% |
| GE Vernova (GEV) | 28 Oct, before the open | $12.64bn vs $11.99bn | $4.81 vs $4.03 | −1.90% |
Guidance (next quarter unless stated):
- Celestica (CLS): FY26 revenue $21.0bn; 2027 revenue target $40bn.
- Vertiv (VRT): Full-year revenue $14.45–14.85bn; EPS $7.10–7.20.
- GE Vernova (GEV): Full-year guidance raised.
2. Memory earnings: SK hynix and Samsung anchor the supercycle
SK hynix reported at 8 PM ET on 27 October. Revenue was ₩104.62T against ₩98.34T (LSEG), and operating profit was ₩83.33T against ₩76.72T, an 80% margin. Net profit was ₩39.78T; the market looked through it to c. ₩100T of planned shareholder returns and DRAM/HBM capacity that is sold out through 2029. The shares rose 10.9% to ₩1,487,000, and the Kospi rose 6.6%.
Samsung Electronics reported after the US close on 28 October (ET). Revenue was ₩195.25T against ₩195.79T, and operating profit was ₩107.44T against ₩107.66T. Its chip division (DS) earned ₩106.5T. HBM is sold out for 2027, but with no upside surprise the shares fell 4.13%. At record levels, the market is paying for the beat, not the level.
Micron set the bar for the season after the US close on 30 September. Revenue was $54.23bn against $51.07bn consensus (+379% on $11.32bn a year earlier), adjusted EPS was $33.42 against $31.61, and the FQ1 guide was $61.5bn ±$1.5bn. The stock was little changed. Among storage peers, Seagate rose 4.51% and Western Digital fell 2.97% on their own reports.
For the memory vol and valuation setup, see Memory Halves: SK hynix and SanDisk lead a brutal chip unwind, When 100% Vol Is Cheap: MU and SanDisk in the AI memory supercycle and our Micron DCF and implied volatility note.
3. Semicap and equipment earnings: capacity-limited
ASML sales of €11.66bn slightly missed €11.72bn, but net income of €4.96bn beat €4.1bn and FY guidance is €44–45bn with the low end raised. Net income included a €0.51bn equity gain. Customers are already asking for 2029–30 slots. Lam Research beat by $0.02 and guided $8.6bn ±$0.4bn, held back by supply. It sees 2027 WFE above $200bn, yet fell 11.76%. KLA guided $4.7bn ±$0.2bn and rose 5.45%. Advantest raised its FY guide to ¥1.863T revenue and ¥967bn operating profit after Q2 sales rose 81.7% year on year at a 55.9% operating margin. The shares rose 6.01%, a read-through for Nvidia and Broadcom test volumes. Tokyo Electron reports before the US open on 30 October (ET); its first full-year guide is the item to watch after two 7% drops on China memory worries.
4. Foundry, logic and analog: Intel’s guide cut dominates
Intel reported after the US close on 29 October. Revenue was $16.51bn against $16.5bn and adjusted EPS $0.52 against $0.40, with data centre and AI revenue up 78% to $7.3bn. The problem was the outlook: Q4 revenue of $15–16bn and EPS of $0.25, against $17.1bn and $0.43, including a c. $600m hit from an explosion at its Israel fab. The shares fell more than 20% after hours.
TSMC beat its own guide with $46.72bn (+41% year on year) and a 66.4% gross margin, and guided Q4 to $52.3–54.3bn with capex of $60–64bn. The ADR still fell 1.80%. Texas Instruments beat ($6.06bn, +28%; data centre +95% year on year) and fell 1.81% on the 22 October semis sell-off. NXP guided to a Q4 midpoint of $3.85bn against $3.86bn and traded c. 9% lower after hours but closed down only 0.71%. STMicroelectronics beat on revenue ($3.76bn, +17.9% year on year), missed EPS consensus with $0.37 and guided Q4 to $4.15bn; the ADR rose 3.03%.
5. Hyperscaler earnings: free cash flow, not capex, set the reaction
Microsoft beat ($92.28bn; Azure +48% to $33.17bn). Capex was $45.2bn, below plan because of delayed third-party capacity, and the calendar 2027 capex view was cut to c. $170bn from $175bn. Free cash flow was $18.63bn, and the stock closed −0.16%. Alphabet missed revenue ($127.58bn vs $128.22bn) and EPS ($2.67 vs $3.02) even as Cloud grew 103% to $30.71bn. FCF was −$9.07bn, and the stock fell 12.64%, erasing c. $500bn of market value. Meta beat with $64.60bn of revenue (GAAP EPS of $3.83 included a $9.89bn charge) and guided Q4 above consensus, but became the first hyperscaler to report negative FCF (−$2.12bn). It raised the floor of its capex range to $135–145bn and fell 6.98%. Amazon missed slightly on revenue and EPS, and AWS grew 39% to $45.98bn, its fastest in about five years. TTM FCF was −$42.4bn with 2026 capex held at $220bn, and the stock was c. 7% lower after hours. Tesla beat but fell 3.08% on weaker auto margins and heavy AI and robotics spending.
6. Software earnings: ServiceNow’s worst day
ServiceNow revenue of $4.106bn matched $4.10bn. Adjusted EPS of $1.00 missed $1.02, and subscription revenue grew 21%. The Q4 cRPO guide of 18.5% against c. 19.5–19.8% set off AI-disruption fears, and the stock fell 26.95% to $109.67, its worst day ever. Fortinet beat and raised FY billings, but product growth of 37% fell short of the c. 50% hoped for and its services guide was trimmed. It fell 20.09%. SAP rose 3.38% as revenue grew 13% to €10.27bn: non-IFRS operating profit of €3.03bn beat €2.94bn, offsetting cloud backlog growth slightly below estimates. IBM beat and raised its software growth outlook to 7–8%, but closed only +0.26%.
7. AI supply chain: power and cooling beat compute
Vertiv had the best AI-infrastructure print of the season. Revenue was $4.313bn (+61%) against $3.76bn, organic orders more than doubled and FY guidance was raised to $14.45–14.85bn; the stock rose 16.48%. GE Vernova beat ($12.64bn; orders $29.3bn, backlog $197bn), but its $9bn Trench deal overshadowed the quarter and the stock closed −1.90%. Celestica grew revenue 83% to $5.83bn and set a $40bn 2027 revenue target, rising 12.12% on the day. Corning’s optical revenue grew 44% to $2.38bn and it beat, but it fell 1.13%.
8. Implied vs realised moves
Implied move is the pre-report at-the-money straddle as a share of the pre-report close; realised move is close-to-close. Amazon and Intel are after-hours moves and are excluded from the median. SK hynix is measured through its Nasdaq-listed ADR (SKHY), from the 27 October close to the 28 October close. Samsung has no US-listed shares or options and is excluded.
| Company | Implied | Realised | |R| / implied |
|---|---|---|---|
| ASML Holding (ASML) | 5.51% | −3.94% | 0.72x |
| TSMC (TSM) | 3.72% | −1.80% | 0.48x |
| Meta Platforms (META) | 7.39%¹ | −6.98% | 0.94x |
| Tesla (TSLA) | 6.48%¹ | −3.08% | 0.48x |
| Texas Instruments (TXN) | 7.66%¹ | −1.81% | 0.24x |
| Lam Research (LRCX) | 7.53%¹ | −11.76% | 1.56x |
| Nokia (NOK) | 8.98%¹ | −14.81% | 1.65x |
| Western Digital (WDC) | 8.43%² | −2.97% | 0.35x |
| Bloom Energy (BE) | 10.76%² | −11.24% | 1.04x |
| Cadence Design Systems (CDNS) | 8.73% | +6.49% | 0.74x |
| Corning (GLW) | 8.69% | −1.13% | 0.13x |
| Seagate Technology (STX) | 8.10% | +4.51% | 0.56x |
| Teradyne (TER) | 10.75% | −3.23% | 0.30x |
| GE Vernova (GEV) | 6.02% | −1.90% | 0.32x |
| Vertiv (VRT) | 10.16% | +16.48% | 1.62x |
| Microsoft (MSFT) | 5.04% | −0.16% | 0.03x |
| Alphabet (GOOGL) | 6.24% | −12.64% | 2.03x |
| ServiceNow (NOW) | 10.64% | −26.95% | 2.53x |
| Fortinet (FTNT) | 11.82% | −20.09% | 1.70x |
| KLA (KLAC) | 7.21% | +5.45% | 0.76x |
| SK hynix ADR (SKHY) | 7.54% | +13.30% | 1.76x |
| Amazon (AMZN) | 8.14% | c. −7.3% after hours | c. 0.90x |
| Intel (INTC) | 8.30% | Fell >20% after hours | >2.4x |
| Company | Reported (ET) | ATM IV pre → post (pts) |
|---|---|---|
| ASML Holding (ASML) | 14 Oct, before the open | 45.6 → 43.7 (−1.9) |
| TSMC (TSM) | 15 Oct, before the open | 33.5 → 31.4 (−2.1) |
| Meta Platforms (META) | 21 Oct, after the close | 45.6 → 32.7 (−12.9) |
| Tesla (TSLA) | 21 Oct, after the close | 42.5 → 40.0 (−2.5) |
| Texas Instruments (TXN) | 21 Oct, after the close | 48.3 → 43.3 (−4.9) |
| Lam Research (LRCX) | 21 Oct, after the close | 59.9 → 57.8 (−2.1) |
| Nokia (NOK) | 22 Oct, before the open | 62.4 → 57.9 (−4.4) |
| Western Digital (WDC) | 22 Oct, after the close | 73.5 → 66.8 (−6.7) |
| Bloom Energy (BE) | 22 Oct, after the close | 88.9 → 78.9 (−10.0) |
Across the 21 names with a closing-price reaction, the median realised move was 0.74x the straddle and 13 of 21 moved less than implied. The misses were large: ServiceNow 2.53x, Alphabet 2.03x, SK hynix 1.76x, Fortinet 1.70x, Nokia 1.65x, Vertiv 1.62x and Lam Research 1.56x, with Intel above 2.4x after hours. The largest drops in ATM implied volatility were at Meta (−12.9 pts), Bloom Energy (−10.0) and Western Digital (−6.7), the pattern described in Crush Without the Move. See also our guide to reading implied volatility and Options Movers.
9. Upcoming semiconductor and tech earnings calendar
| Company | Report | What to watch |
|---|---|---|
| Tokyo Electron (8035.T) | 30 Oct, before the open (ET) | First full-year guide; China memory exposure |
| Apple (AAPL) | 2 Nov, after the close; call 5 PM ET | First print under CEO John Ternus |
| Palantir (PLTR) | 2 Nov | Software sentiment after NOW/FTNT |
| onsemi (ON) | 2 Nov | Auto/industrial analog after NXPI/STM |
| AMD (AMD) | 3 Nov, after the close; call 5 PM ET | MI-series GPU ramp |
| Arista Networks (ANET) | 3 Nov | AI back-end Ethernet |
| Eaton (ETN) | 3 Nov | Data-centre power peer of VRT/GEV |
| Super Micro Computer (SMCI) | 3 Nov | AI server margins and execution |
| Qualcomm (QCOM) | 4 Nov, after the close; call 4:45 PM ET | Handset plus AI PC/data centre |
| Arm Holdings (ARM) | 4 Nov, after the close; webcast 5 PM ET | Royalty and data-centre CPU share |
| Coherent (COHR) | 4 Nov | AI optical transceivers |
| Infineon (IFX) | 10 Nov, 1:30 AM ET | AI power semis |
| Applied Materials (AMAT) | 12 Nov | Last big WFE print after LRCX/KLAC/TEL |
| Nvidia (NVDA) | 17 Nov, c. 4:20 PM ET; call 5 PM ET | The AI bellwether |
| Analog Devices (ADI) | 24 Nov | Analog cycle |
| Dell Technologies (DELL) | 24 Nov | AI server backlog |
| Marvell Technology (MRVL) | 1 Dec | Custom ASICs and optics |
| Snowflake (SNOW) | 2 Dec | Data/AI software |
| Salesforce (CRM) | 2 Dec | Agentforce and SaaS sentiment |
| Oracle (ORCL) | 9 Dec (expected) | OCI/RPO; debt-funded AI capex |
| Adobe (ADBE) | 9 Dec (expected) | AI disruption of creative software |
| Broadcom (AVGO) | 11 Dec (expected) | Custom AI ASICs and networking |
| Micron Technology (MU) | Mid/late Dec (expected) | Guide $61.5bn ±$1.5bn, EPS $38.15 |
PLTR (10.03%), SMCI (9.53%) and ARM (8.80%) carry the largest event premia next week. Apple prices only 3.37%, against a 1-year IV rank of 56. If this season’s 0.74x median holds, those premia look rich, but the Intel and ServiceNow tails argue for defined risk.
Our view
Memory is the cleanest fundamental story, but the stocks need beats, not records. SK hynix rose on a beat; Samsung fell on an in-line record.
Guidance and cash flow are the filter. At Intel, ServiceNow, Fortinet and Alphabet, a miss on a forward metric produced 1.7–2.5x the priced move; beats with in-line guidance were sold at Lam Research, TSMC and NXP.
Straddles are generally rich. A median ratio of 0.74x favours sellers, but the fat tails call for defined risk into AMD, Qualcomm, Arm and Nvidia.
What would change our view
- Tokyo Electron guiding for a full-year operating profit well below the c. ¥1.0T market view would extend the semicap supply/China worry beyond Lam.
- AMD or Nvidia guiding below consensus would bring the INTC pattern into AI compute.
- Intel and Amazon reversing their after-hours moves in regular trading would weaken the case that guidance misses are under-priced.
Q3 2026 earnings season FAQ
Which companies have reported Q3 2026 earnings in semis and tech?
This note covers 25 reported names: Micron, SK hynix, Samsung, ASML, Lam Research, Advantest, KLA, TSMC, Texas Instruments, NXP, STMicroelectronics, Intel, Meta, Tesla, Microsoft, Alphabet, Amazon, IBM, SAP, ServiceNow, Fortinet, Celestica, Corning, Vertiv and GE Vernova.
Why did Intel stock fall after beating earnings?
Intel beat Q3 with adjusted EPS of $0.52 against $0.40, but guided Q4 revenue to $15–16bn and EPS to $0.25, against $17.1bn and $0.43 expected, partly because of a c. $600m hit from an Israel fab incident. The shares fell more than 20% after hours.
Why did ServiceNow stock crash?
ServiceNow guided Q4 cRPO growth to 18.5% against c. 19.5–19.8% expected and missed adjusted EPS by $0.02. The stock fell 26.95% to $109.67, its worst day ever, as investors priced AI disruption risk to SaaS.
How did SK hynix and Samsung earnings compare?
SK hynix beat on revenue (₩104.62T vs ₩98.34T) and operating profit (₩83.33T vs ₩76.72T) and rose 10.9%. Samsung’s operating profit of ₩107.44T was in line with the ₩107.66T consensus, and the shares fell 4.13%.
Did options overprice Q3 2026 earnings moves?
Mostly yes. Across 21 names with a closing-price reaction, the median realised move was 0.74x the pre-report ATM straddle and only 8 of 21 moved more than implied. Moves for ServiceNow, Alphabet and Fortinet were c. 1.7–2.5x their implied moves.
When does Nvidia report Q3 FY2027 earnings?
Nvidia reports after the US close on 17 November, with its call at 5 PM ET.
Methodology
Results are from company releases; consensus is from LSEG, FactSet or company-compiled estimates. Implied move = pre-event ATM straddle ÷ spot. Realised move = close-to-close. Upcoming event moves are derived from the ATM implied-volatility term structure.
This note is for educational purposes only and is not investment advice or a recommendation to buy or sell any security or derivative. Options involve risk and are not suitable for all investors.